Copax — Senior UX Designer
Copax.
Senior UX Design with the Copax Fleet Operations team
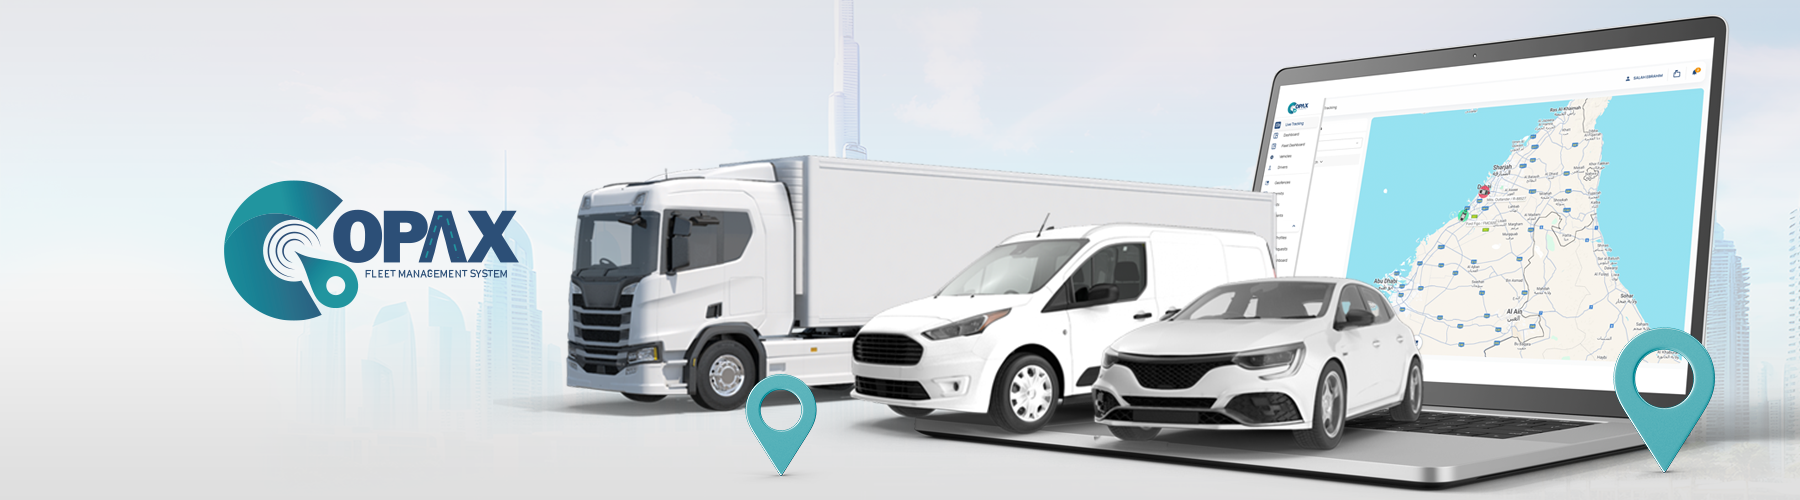
I led the redesign of an enterprise fleet management platform — turning a fragmented, complex interface into a unified real-time dashboard for fleet managers across the UAE. End-to-end UX research, design thinking, prototyping and final UI design.
- Duration
- 8 Months
- Tools
- Figma, FigJam, Miro
- Team
- Copax Product Team
- Year
- 2024
📋Overview
A Fleet Management System is a tool to manage, track and operate a fleet of vehicles efficiently. It relies on technology to monitor commercial vehicles — tracking location, ownership and condition on the road. It finds extensive application in logistics, transportation and delivery for smooth operations and compliance.
As Senior UX Designer at Copax, I led the redesign of the entire fleet operations dashboard — turning a complex, fragmented interface into a unified, intuitive experience for fleet managers across the UAE.
👩💻Stakeholders
I worked closely with fleet managers, drivers, operations leads and the engineering team across multiple Copax client companies — a mix of logistics firms, car-rental businesses, and contracting companies operating large vehicle fleets in the UAE.
⚡️The Challenge
The existing fleet management system was complex, slow and fragmented. Users had to switch between disconnected screens to find vehicle locations, generate reports, or set up geofences. Critical alerts arrived too late, navigation was unintuitive, and reporting was almost entirely manual.
My challenge was to redesign the platform as a unified, real-time interface — one that fleet managers could use to make informed decisions effortlessly, regardless of technical expertise.
🔍Research
I conducted in-depth user interviews with fleet managers from a diverse set of companies — logistics, rentals, contracting, e-commerce. The goal was to uncover their pain points, daily workflows, and what would actually save them time.
“Having all that information on one screen in real time — performance status, location, driver status — would save me hours.”
“I want to see a timeline of each vehicle's activities within a day. Real-time notifications for breakdowns, geofence violations or driver issues.”
💡Key Insights
- Real-Time VisibilityLive vehicle locations, driver status and performance metrics needed in one unified view.
- Proactive AlertsThreshold-based notifications for costs, maintenance and geofence breaches prevent costly oversights.
- Profitability TrackingReal-time cost-and-revenue data per vehicle drives smarter decisions.
STEP 01
Live Tracking
I transformed the live tracking feature into an intuitive, visually dynamic tool — color-coded map markers, enhanced search, interactive tooltips and persistent vehicle summaries.
STEP 02
Vehicle Control
I streamlined Vehicle Control and Event Management to provide easy access to real-time vehicle data through intuitive dashboards and simplified navigation.
STEP 03
Geofencing
A geofence builder where users can draw zones, assign vehicles, and monitor speed. Real-time notifications alert managers when vehicles enter or exit geofences or exceed limits.
STEP 04
Trip Management
Detailed trip history, real-time event tracking during journeys, and the option to replay past trips — providing essential data on routes, durations and events to optimize fleet performance.
STEP 05
Reports & Notifications
Trip reports, vehicle reports, geofencing reports and custom reports — all configurable through an intuitive checkbox system. Notifications are filterable by priority and type.
📊Results
- 30% Improvement in System EfficiencyBy turning the fragmented interface into a unified, intuitive experience.
- 20% Boost in User RetentionEasier workflows kept fleet managers engaged with the platform daily.
- 40% Reduction in Task Completion TimeQuicker access to data and clearer flows shortened common tasks dramatically.
- 35% Decrease in User ErrorsClearer navigation and contextual feedback reduced misclicks and confusion.
- 50% Increase in Mobile EngagementA redesigned responsive view brought managers back on the go.
🌟User research is everything
The single most impactful thing I did was sit down with fleet managers and listen. The patterns I uncovered — fragmentation, manual reporting, alert delays — were the exact things the redesign solved.
✨Iterate from low to high fidelity
Lo-fi wireframes let us validate flows fast without getting attached to visuals. By the time I moved to high-fidelity, the structure was already proven.